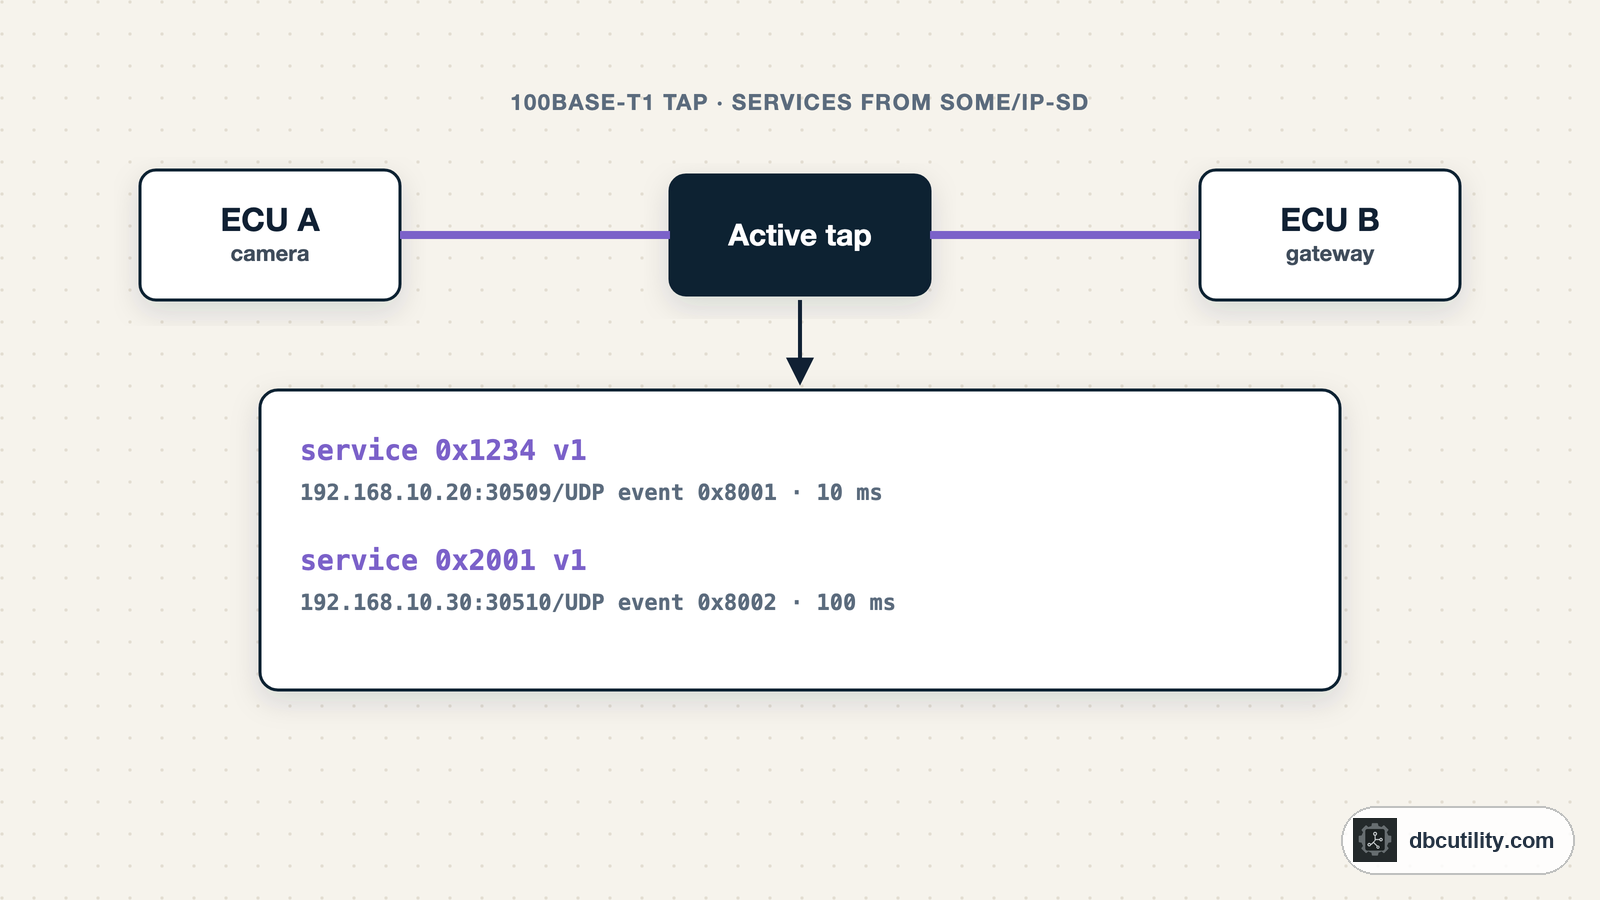
In short
Capture with a media converter or an active tap, never a laptop port alone. Read the SOME/IP-SD offers first; they tell you which ECU provides which service at which address. Then group SOME/IP messages by service and method and analyse each payload exactly like a CAN payload.
Best for: Engineers reverse engineering Ethernet-based ECUs such as cameras, gateways and infotainment units
A camera, a gateway or an infotainment unit on automotive Ethernet does not send CAN frames you can decode with a DBC. It sends IP packets, often SOME/IP, and its interface is described in ARXML or FIBEX files you do not have. The good news: SOME/IP announces itself. Service discovery tells you who offers what, and once you know which messages belong to which service, the payloads give up their signals to the same methods that work on CAN.
If SOME/IP is new to you, read SOME/IP and SOME/IP-SD explained first.
Step 1: get the packets
Automotive Ethernet links between ECUs use single twisted pair physical layers: 100BASE-T1 (IEEE 802.3bw), 1000BASE-T1 (802.3bp) or 10BASE-T1S (802.3cg). A laptop's RJ45 port speaks none of them. Three ways in:
| Method | How | When |
|---|---|---|
| Media converter | Converts one T1 link to standard Ethernet; you become one end of the link | Talking to a single ECU on the bench |
| Active tap | Sits inside the link between two ECUs and copies both directions to your capture port | Watching a live link in a vehicle without disturbing it |
| Switch mirror port | The ECU's or a bench switch's port mirroring copies traffic to a spare port | When you can configure the switch |
On a bench with one ECU, a media converter is usually enough: once its link is up, the ECU typically starts offering its services. In a vehicle, a tap sees what the ECUs really say to each other. Capture with tcpdump or Wireshark into a pcap file. Vehicle networks often use VLANs (IEEE 802.1Q), so keep the VLAN tags in the capture.
To follow along without hardware, make_capture.py writes a 20-second synthetic capture with two ECUs, one of them on VLAN 10:
python3 make_capture.py capture.pcapStep 2: read the pcap
Wireshark is the best way to browse a capture. For analysis you need the packets in code, and a classic pcap file is simple enough to read with the standard library. This reader handles Ethernet, VLAN tags, IPv4 and UDP:
import ipaddress
import struct


def udp_packets(path):
    """Yield (time, src, dst, sport, dport, payload) for IPv4/UDP packets in a classic pcap file."""
    with open(path, "rb") as f:
        magic = f.read(24)[:4]
        endian = "<" if magic in (b"\xd4\xc3\xb2\xa1", b"\x4d\x3c\xb2\xa1") else ">"
        while header := f.read(16):
            sec, frac, length, _ = struct.unpack(endian + "IIII", header)
            data = f.read(length)
            offset, ethertype = 14, struct.unpack(">H", data[12:14])[0]
            while ethertype == 0x8100:  # skip 802.1Q VLAN tags
                ethertype = struct.unpack(">H", data[offset + 2:offset + 4])[0]
                offset += 4
            if ethertype != 0x0800 or data[offset + 9] != 17:  # IPv4 and UDP only
                continue
            ihl = (data[offset] & 0x0F) * 4
            src, dst = (str(ipaddress.IPv4Address(data[offset + i:offset + i + 4])) for i in (12, 16))
            udp = offset + ihl
            sport, dport, udp_length = struct.unpack(">HHH", data[udp:udp + 6])
            yield sec + frac / 1e6, src, dst, sport, dport, data[udp + 8:udp + udp_length]
Step 3: list the services
Every SOME/IP-SD message starts with FF FF 81 00. Its OfferService entries, with their IPv4 endpoint options, tell you which ECU provides which service, at which address and port:
def offered_services(path):
    """Every OfferService seen in SOME/IP-SD: (service, instance, major) -> (offering IP, endpoint)."""
    services = {}
    for _, src, _, _, dport, payload in udp_packets(path):
        if payload[:4] != b"\xff\xff\x81\x00":  # SOME/IP-SD
            continue
        body = payload[16:]
        entries_length = struct.unpack(">I", body[4:8])[0]
        entries = body[8:8 + entries_length]
        raw, options = body[12 + entries_length:], []
        while len(raw) >= 3:  # split the options array: 2-byte length, 1-byte type, 1 reserved, body
            length = struct.unpack(">H", raw[:2])[0]
            options.append((raw[2], raw[4:3 + length]))
            raw = raw[3 + length:]
        for i in range(0, len(entries), 16):
            kind, first, _, counts, service, instance, major = struct.unpack(">BBBBHHB", entries[i:i + 9])
            ttl = int.from_bytes(entries[i + 9:i + 12], "big")
            for kind_option, option in options[first:first + (counts >> 4)]:
                if kind == 0x01 and ttl and kind_option == 0x04:  # OfferService with an IPv4 endpoint
                    ip, proto, port = ipaddress.IPv4Address(option[:4]), option[5], struct.unpack(">H", option[6:8])[0]
                    endpoint = f"{ip}:{port}/{'UDP' if proto == 0x11 else 'TCP'}"
                    services[(service, instance, major)] = (src, endpoint)
    return services


for (service, instance, major), (src, endpoint) in sorted(offered_services("capture.pcap").items()):
    print(f"service 0x{service:04X} instance 0x{instance:04X} v{major}  offered by {src}  at {endpoint}")
Output:
service 0x1234 instance 0x0001 v1  offered by 192.168.10.20  at 192.168.10.20:30509/UDP
service 0x2001 instance 0x0001 v1  offered by 192.168.10.30  at 192.168.10.30:30510/UDP
This inventory is your map. It is to automotive Ethernet what a list of CAN IDs and transmitters is to CAN. Note the major version too: if a client and server disagree on it, they do not talk.
Step 4: survey the traffic per message
Group the SOME/IP messages by service, method and message type, then measure how often each one is sent and how often each payload byte changes:
from collections import defaultdict


def traffic(path):
    """Per SOME/IP message ID: count, period and how often each payload byte changes."""
    seen = defaultdict(list)
    for t, _, _, _, _, payload in udp_packets(path):
        if len(payload) >= 16 and payload[:4] != b"\xff\xff\x81\x00" and payload[12] == 0x01:
            service, method = struct.unpack(">HH", payload[:4])
            seen[(service, method, payload[14])].append((t, payload[16:]))
    for (service, method, mtype), items in sorted(seen.items()):
        period = (items[-1][0] - items[0][0]) / max(1, len(items) - 1) * 1000
        datas = [d for _, d in items]
        rates = [sum(a[i] != b[i] for a, b in zip(datas, datas[1:])) / max(1, len(datas) - 1)
                 for i in range(min(map(len, datas)))]
        print(f"0x{service:04X}.0x{method:04X} type 0x{mtype:02X}  {len(items):5} msgs  {period:6.1f} ms  "
              f"payload {len(datas[0])} bytes, change rate " + " ".join(f"{r:.2f}" for r in rates))


traffic("capture.pcap")
Output:
0x1234.0x8001 type 0x02   2000 msgs    10.0 ms  payload 4 bytes, change rate 0.03 0.97 1.00 0.00
0x2001.0x8002 type 0x02    200 msgs   100.0 ms  payload 4 bytes, change rate 0.01 0.00 0.00 0.00
Read it like a CAN survey:
0x1234.0x8001is an event (top bit of the method ID set, type0x02NOTIFICATION) sent every 10 ms. Byte 2 changes in every message: a counter. Bytes 0 and 1 together look like a 16-bit value whose low byte changes almost every time.0x2001.0x8002is an event every 100 ms whose byte 0 changes only a few times: a state or a switch.
From here, the method is the same as on CAN: change one thing on the vehicle, watch which bytes follow, then fit scale and offset against a reference. The payload byte order is set per interface by configuration, so test both. The AI-assisted pipeline works on these payloads once you turn each message into a timestamp and a byte string.
What makes Ethernet different from CAN
| Topic | CAN | SOME/IP over Ethernet |
|---|---|---|
| Who sends what | CAN ID, fixed at design time | Service and method ID; the sender's IP comes from service discovery |
| Broadcast | Every node sees every frame | Events go only to subscribed clients; a tap sees one link, not the whole network |
| Payload size | 8 or 64 bytes | Up to 1400 bytes over UDP, more over TCP or with SOME/IP-TP |
| Description file | DBC, ARXML | ARXML, FIBEX |
| Requests | Rare outside diagnostics | Methods are request and response; you can call them yourself |
Two consequences matter for reverse engineering:
- You only see what crosses your link. An event is sent only after a client subscribes. If nothing on your side of the tap subscribes, you see the offers but no data. On a bench, you can subscribe yourself by sending a SubscribeEventgroup to the server.
- Methods can be called. A service that offers a getter method answers a REQUEST from you. Like a UDS DID scan, try the method IDs of an offered service and note which return E_OK, E_UNKNOWN_METHOD (
0x03) or E_MALFORMED_MESSAGE (0x09). Only send requests to ECUs on a bench, never to a moving vehicle.
When payloads look random
If every byte of every payload changes all the time, the traffic may be encrypted or authenticated. Newer designs can protect Ethernet links with MACsec or messages with SecOC, and diagnostic and backend connections with TLS. Then payload analysis stops at the header; the SecOC guide explains what you can still see.
Frequently asked questions
How do I capture automotive Ethernet traffic?
Use a media converter for the link's physical layer, such as 100BASE-T1, to connect a laptop to one ECU, or an active tap to copy a live link between two ECUs. Then record with tcpdump or Wireshark. A normal RJ45 port cannot connect to a T1 link directly.
How do I find SOME/IP services without ARXML?
Read the SOME/IP-SD traffic. OfferService entries carry the service ID, instance ID, version and the IP address, protocol and port where the service is reached. Then group the SOME/IP messages by service and method ID.
Can Wireshark decode SOME/IP payloads?
It decodes the SOME/IP header and service discovery. Payload parameters need definitions, usually taken from ARXML or FIBEX. Without them, analyse payload bytes the same way as CAN signals.
Why do I see SOME/IP offers but no events?
Events are only sent to subscribed clients. If no client on your link subscribes to the eventgroup, the server has no reason to send events there. Check for SubscribeEventgroup and SubscribeEventgroupAck entries.
References
DBC Utility
One desktop app for DBC files and CAN recordings.
One-time $34 · Windows & Linux · Files stay on your computer