In short
Most CAN integration bugs are visible in a recording if you know what to compare. Check every message against its DBC definition: period and gaps against GenMsgCycleTime, length against the DLC, every decoded signal against its range, counters and CRCs frame by frame, and IDs that the DBC does not define. Automate it, and every recording gets the same review.
Best for: Test, validation and integration engineers who review CAN recordings from benches, HIL systems or test drives
After a test drive or a night on the HIL bench, there is a recording with millions of frames, and someone has to say whether the network behaved. Plotting a few signals catches the obvious problems. The ones that cause field issues, a message that stops for 80 ms once an hour, a counter that skips, a CRC that is wrong in one frame of a thousand, need every frame checked against the specification. That is a job for a script.
What to check
| Check | Compare | Typical cause of a finding |
|---|---|---|
| Cycle time | Mean period against GenMsgCycleTime | Wrong task rate, overloaded ECU, wrong DBC |
| Timeout | Longest gap against a few cycle times | ECU reset, bus-off, gateway overload |
| Length | Frame length against the DBC's DLC | Wrong software variant, wrong DBC version |
| Range | Every decoded signal against its min and max | Invalid or "not available" values, wrong scaling |
| Counter | Each alive counter steps by one | Lost frames, a task that ran twice |
| CRC | Each CRC matches its payload | Wrong Data ID, wrong byte order, corrupted frames |
| Unknown IDs | IDs that the DBC does not define | A new software version, a wrong DBC, diagnostics left on |
Each check needs only the DBC and the recording. The first five are generic; counters and CRCs need the message's protection scheme.
The checker
from collections import defaultdict

import cantools


def load_log(path):
    frames = defaultdict(list)
    for line in open(path):
        stamp, _, frame = line.split()
        can_id, data = frame.split("#")
        frames[int(can_id, 16)].append((float(stamp.strip("()")), bytes.fromhex(data)))
    return frames


def check_log(db, frames, protection=None, tolerance=0.1, timeout_cycles=3):
    """Compare a recording with the DBC. Returns a list of findings; empty means every check passed."""
    findings = []
    for can_id in sorted(frames):
        try:
            message = db.get_message_by_frame_id(can_id)
        except KeyError:
            findings.append(f"0x{can_id:03X}: ID not in the DBC ({len(frames[can_id])} frames)")
            continue
        items = frames[can_id]
        if message.cycle_time:  # cycle time and timeouts
            cycle = message.cycle_time / 1000
            gaps = [b[0] - a[0] for a, b in zip(items, items[1:])]
            mean = sum(gaps) / len(gaps)
            if abs(mean - cycle) > tolerance * cycle:
                findings.append(f"{message.name}: mean period {mean * 1000:.1f} ms, DBC says {message.cycle_time} ms")
            for (t, _), gap in zip(items, gaps):
                if gap > timeout_cycles * cycle:
                    findings.append(f"{message.name}: no frame for {gap * 1000:.0f} ms after t={t - items[0][0]:.2f} s")
        for t, data in items:
            when = f"t={t - items[0][0]:.2f} s"
            if len(data) != message.length:
                findings.append(f"{message.name}: {len(data)} bytes at {when}, DBC says {message.length}")
                continue
            for name, value in message.decode(data, decode_choices=False).items():
                signal = message.get_signal_by_name(name)
                if signal.minimum is not None and not signal.minimum <= value <= signal.maximum:
                    findings.append(f"{message.name}.{name} = {value} at {when}, range {signal.minimum}..{signal.maximum}")
        if protection and message.name in protection:
            findings += [f"{message.name}: {problem}" for problem in protection[message.name](items)]
    return findings
decode_choices=False keeps the numeric values so they can be compared with the signal's range. The counter and CRC checks are passed in per message, because every manufacturer protects messages differently. For the ESP speed message in this example, the layout from the counters and CRC guide:
DATA_ID = [0x5D, 0x12, 0xA7, 0x3C, 0xE1, 0x48, 0x9B, 0x06, 0x71, 0xC4, 0x2F, 0x88, 0xD3, 0x6A, 0xB5, 0x19]


def crc8h2f(data):
    crc = 0xFF
    for byte in data:
        crc ^= byte
        for _ in range(8):
            crc = ((crc << 1) ^ 0x2F) & 0xFF if crc & 0x80 else (crc << 1) & 0xFF
    return crc ^ 0xFF


def check_esp_speed(items):
    """Counter in the low nibble of byte 1 must step by 1; byte 0 must be the CRC-8H2F."""
    problems, previous = [], None
    for t, data in items:
        counter = data[1] & 0x0F
        if previous is not None and counter != (previous + 1) & 0x0F:
            problems.append(f"counter {previous} -> {counter} at t={t - items[0][0]:.2f} s")
        if data[0] != crc8h2f(data[1:] + bytes([DATA_ID[counter]])):
            problems.append(f"wrong CRC at t={t - items[0][0]:.2f} s")
        previous = counter
    return problems


db = cantools.database.load_file("checks.dbc")
for finding in check_log(db, load_log("test_drive.log"), protection={"ESP_Speed": check_esp_speed}):
    print(finding)
Running it on a recording with known faults
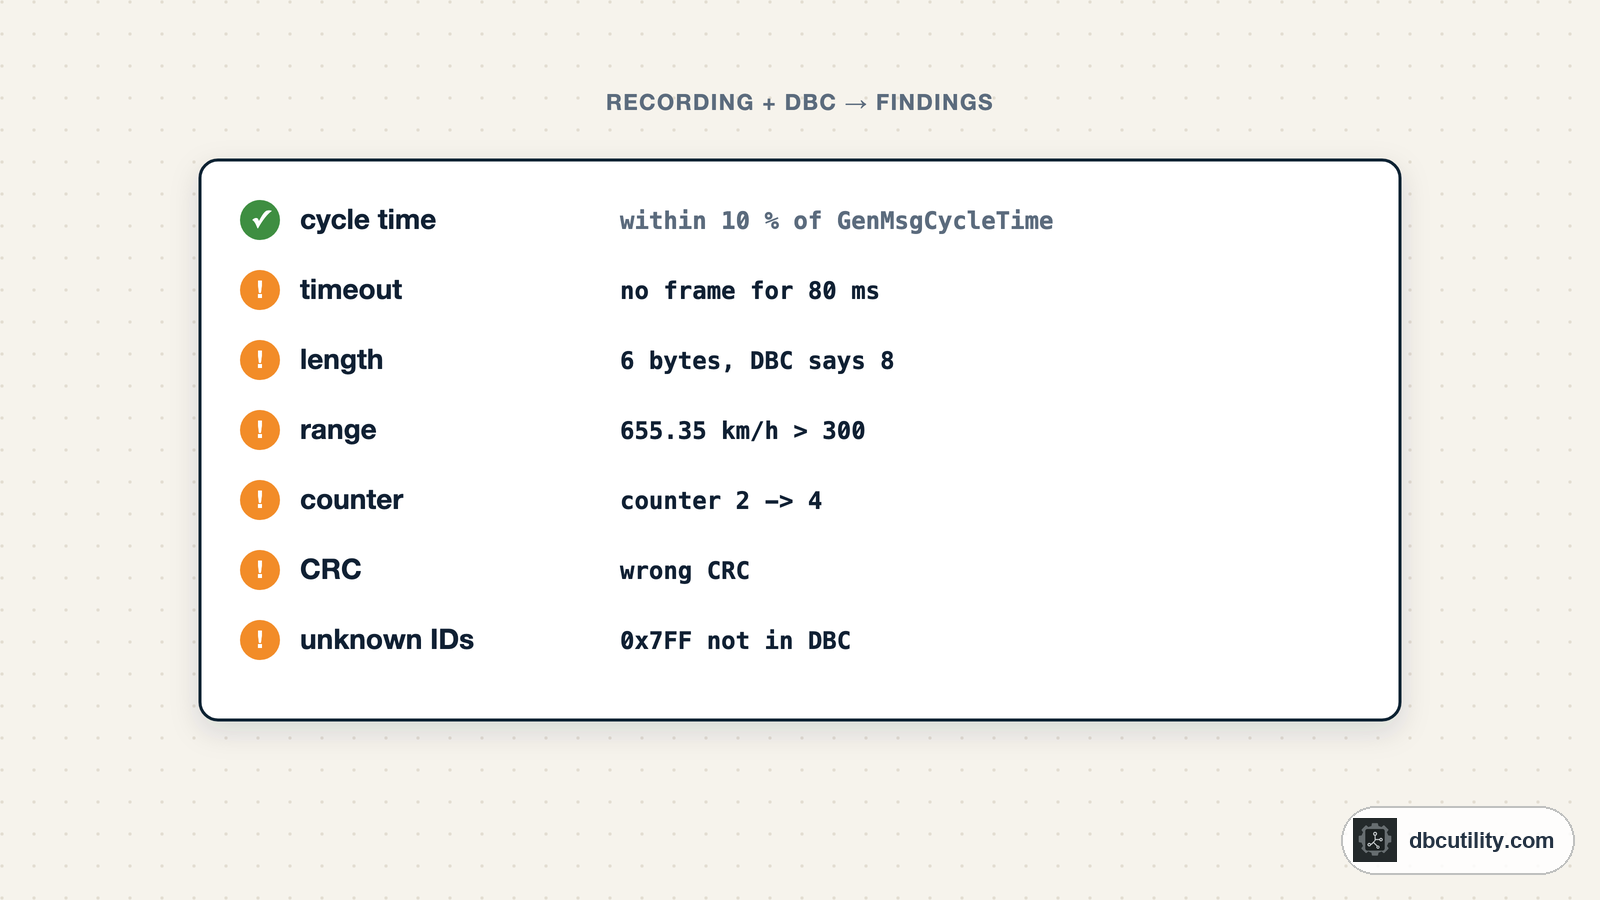
The example recording is 5 seconds of traffic with six faults planted on purpose, checked against an example DBC:
ESP_Speed: no frame for 80 ms after t=2.00 s
ESP_Speed.VehicleSpeed = 655.35 at t=4.00 s, range 0..300
ESP_Speed: wrong CRC at t=2.00 s
ESP_Speed: counter 2 -> 4 at t=3.00 s
Engine_Data: 6 bytes at t=2.40 s, DBC says 8
0x7FF: ID not in the DBC (1 frames)
All six are found, and nothing else is reported:
- The 80 ms gap: three frames of a 20 ms message are missing. The mean period stays within 10 %, so only the gap check catches it.
- 655.35 km/h: the raw value is
0xFFFF. All ones often means "signal not available" (J1939 defines it that way); a value table in the DBC should say so, and the finding tells you it does not. - The wrong CRC and the counter jump: one frame each, invisible in any plot.
- 6 bytes instead of 8: one frame with the wrong length, which a receiver may drop.
0x7FF: a frame the DBC does not define.
Making it a test
Wrap the checker in a pytest test, and every recording that lands in a folder gets the same review in CI:
DB = cantools.database.load_file("checks.dbc")


def test_recording_matches_dbc():
    findings = check_log(DB, load_log("test_drive.log"), protection={"ESP_Speed": check_esp_speed})
    assert not findings, "\n".join(findings)
pytest test_drive_checks.py fails with every finding listed in the message. For a long recording, write the findings to a file or a table instead of failing on the first, so the reviewer sees everything at once.
Making the checks fit your network
- Event messages have no cycle time. Leave
GenMsgCycleTimeempty or zero for them; the checker then skips the timing checks. - Messages with a fast mode, such as a message that switches from 100 ms to 10 ms when a value changes, need a timing check that knows both cycle times. The DBC attributes
GenMsgCycleTimeFastandGenMsgSendTypedescribe them in many DBCs. - Start-up and shutdown: the first and last seconds of a recording often contain legitimate gaps. Cut them, or check them with their own rules.
- Tolerances come from your network specification. 10 % and three cycle times are starting points, not standards.
- Signals without a range (
[0|0]in the DBC) skip the range check. Fill in ranges; it is cheap and finds real bugs.
The same idea, as a desktop workflow: DBC Utility's log analyser maps a DBC onto ASC and BLF recordings and reports message timing, lengths and IDs the DBC does not cover.
Frequently asked questions
How do I check CAN cycle times in a log?
Group the frames by ID, compute the gaps between consecutive timestamps, and compare the mean gap with the message's GenMsgCycleTime from the DBC. Also check the longest gap against a timeout limit, because a few missing frames barely change the mean.
How do I find CAN signals that are out of range?
Decode every frame with the DBC and compare each signal's physical value with the minimum and maximum defined for it. Values such as 0xFF or 0xFFFF often mean "not available"; if they appear as out of range, the DBC is missing that definition.
Can I validate CAN logs automatically in CI?
Yes. Load the DBC and the recording in a test, run the checks, and fail the test with a list of findings. python-can reads most log formats and cantools decodes them with the DBC.
What is GenMsgCycleTime?
A message attribute used in many DBC files for the message's cycle time in milliseconds. It is a convention rather than part of the core DBC syntax, but most tools read it, and cantools exposes it as message.cycle_time.
References
DBC Utility
One desktop app for DBC files and CAN recordings.
One-time $34 · Windows & Linux · Files stay on your computer